We release the new CARLA 0.8.2, presenting a new redefined driving benchmark and releasing an agent trained with reinforcement learning. The benchmark allows to easily compare autonomous driving algorithms on sets of strictly defined goal-directed navigation tasks. As a starting point, we provide the task suite studied in our CoRL-2017 paper, as well as agents trained with conditional imitation learning and reinforcement learning. Get CARLA 0.8.2 and try to beat our driving agents!
Reproducible research on autonomous driving is complicated by the lack of open tools for rigorous benchmarking. With this CARLA release, we take a step towards providing such a standard testing environment. We release a convenient interface for defining suites of tasks and autonomous agents.
The CARLA 0.8.2 release also adds few other improvements and fixes
- Rolled back vehicle’s location to the pivot of the mesh instead of the center of the bounding box, this fixes various bugs due to the vehicle’s position not being always coherent. Now we send too the relative transform of the bounding box which in turn also increases the flexibility in which new vehicles can be incorporated.
- Added a frame number field to each sensor measurement, this allows synchronization between all the measurements based on the frame they are produced. The frame number steadily increases each frame and it’s not reset on each new episode.
- Walkers use now a closer angle to detect vehicles, so they don’t stop moving if a car passes nearby.
- Improved how vehicles are spawned to better handle spawning failures.
- Fixed lighting artefact causing the road to change its brightness depending on the distance to the camera. This was especially noticeable in Town02.
- Fixed captured images overexposed in Low mode.
- Fixed illegal character in asset name.
- Fixed editing sun azimuth angle in CarlaWeadther.ini had no effect.
- Fixed crash when using a non-standard image size in DirectX (Windows).
Driving benchmark overview
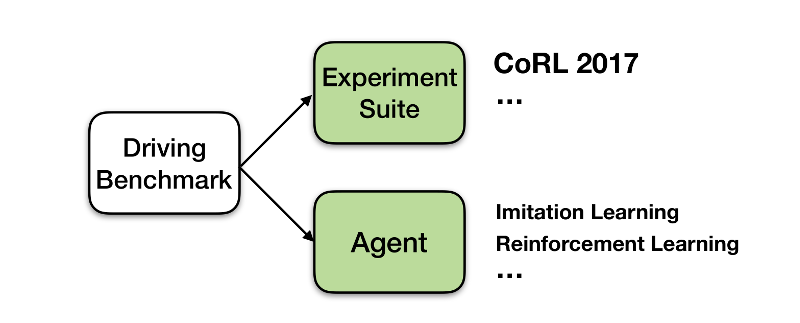
Figure 1: Overview of the driving benchmark module, agents and new experiment suites (tasks) could easily be placed on the driving benchmark.
The driving benchmark provides a convenient python interface for testing driving agents on experiment suites (Figure 1). You can either make use of our pre-implemented agents and experiment suites, or develop your own.
Defining a new agent boils down to implementing a single function that takes current observations as input and outputs a control signal. The interface is agnostic to the type of agent: reinforcement learning, imitation learning, classical modular pipeline, etc. We currently provide two agents: trained with conditional imitation learning and with reinforcement learning.
We encourage everyone to use our CoRL-2017 tasks, but you can also easily create your own task suites to challenge your agent. The task suite definition includes the number of navigation trials, starting locations and end goals, types and properties of observations available to the agent, as well as environment properties such as the weather and the number of pedestrians and vehicles. Further information can be found at the driving benchmark documentation, where you can get started by checking out a simple example.
Results
We use the new driving benchmark to re-evaluate agents from our CoRL-2017 paper. We evaluate two deep-learning-based agents:
- Reinforcement Learning, trained with A3C over 12 days of in-simulation experience.
- Conditional Imitation Learning, trained with 14 hours of expert demonstrations.
The experiment suite includes four tasks of increasing difficulty:
- Straight: the goal is straight ahead of the starting position.
- One turn: getting to the goal takes one turn, left or right.
- Navigation: navigation with an arbitrary number of turns.
- Navigation with dynamic obstacles: same as previous task, but with other vehicles and pedestrians.
As our main quantitative metric, we use the success rate - the percentage of episodes where the agent is able to reach the goal. To get more consistent results, we ran the benchmark three times (unfortunately, there is a small random difference between different runs, see details below).
We report the mean and the standard deviation over three runs in Tables 1 and 2. The results are very close to those reported in the CoRL-2017 paper, but do not always match exactly. These small discrepancies are due to randomness in evaluation and minor difference in texture appearance compared to the earlier version of CARLA used in the CoRL-2017 paper.
Percentage of Success, Imitation Learning
| Task | Training Conditions | New Town | New Weather | New Town & Weather |
|---|---|---|---|---|
| Straight | 95 ± 0.8 | 98 ± 0.0 | 95 ± 0.9 | 90 ± 1.7 |
| One Turn | 89 ± 0.0 | 73 ± 0.8 | 88 ± 1.8 | 74 ± 1.7 |
| Navigation | 83 ± 0.9 | 61 ± 1.7 | 76 ± 1.6 | 57 ± 6.6 |
| Nav. Dynamic | 82 ± 0.9 | 53 ± 2.9 | 78 ± 0.0 | 47 ± 3.4 |
Table 1: Success rate for imitation learning over three runs of the benchmark (mean and standard deviation shown).
Percentage of Success, Reinforcement Learning
| Task | Training Conditions | New Town | New Weather | New Town & Weather |
|---|---|---|---|---|
| Straight | 88 ± 0.5 | 79 ± 2.0 | 74 ± 1.8 | 80 ± 2.4 |
| One Turn | 24 ± 2.4 | 14 ± 1.7 | 16 ± 0.8 | 10 ± 2.8 |
| Navigation | 11 ± 0.5 | 7 ± 0.8 | 6 ± 1.8 | 7 ± 0.8 |
| Nav. Dynamic | 7 ± 0.5 | 5 ± 0.5 | 4 ± 1.6 | 6 ± 1.6 |
Table 2: Success rate for reinforcement learning over three runs of the benchmark (mean and standard deviation shown).
We additionally show the average number of kilometers travelled without making an infraction. Same as for success rate, we compute the mean and the standard deviation between three runs. Same as in our CoRL-2017 paper, infractions are only computed on the fourth task - “Navigation with dynamic obstacles”.
Infractions Imitation Learning
| Infractions | Training Conditions | New Town | New Weather | New Town & Weather |
|---|---|---|---|---|
| Opposite Lane | 50.0 ± 23.6 | 2.6 ± 0.1 | 33.7 ± 0.4 | 3.8 ± 0.4 |
| Sidewalk | 15.6 ± 5.2 | 1.2 ± 0.1 | 5.6 ± 0.1 | 1.1 ± 0.1 |
| Collision-static | 2.4 ± 0.5 | 0.6 ± 0.1 | 4.1 ± 1.9 | 0.5 ± 0.1 |
| Collision-car | 3.0 ± 0.7 | 0.6 ± 0.1 | 2.2 ± 0.6 | 0.5 ± 0.1 |
| Collision-pedestrian | 3.3 ± 0.2 | 2.5 ± 0.7 | 5.0 ± 0.9 | 1.8 ± 0.4 |
Table 3: Average number of kilometers travelled before an infraction by the imitation learning agent. We show mean and standard deviation over three runs.
Infractions Reinforcement Learning
| Infractions | Training Conditions | New Town | New Weather | New Town & Weather |
|---|---|---|---|---|
| Opposite Lane | 0.11 ± 0.09 | 0.10 ± 0.00 | 0.11 ± 0.05 | 0.11 ± 0.00 |
| Sidewalk | 0.36 ± 0.01 | 0.17 ± 0.01 | 0.29 ± 0.01 | 0.18 ± 0.01 |
| Collision-static | 0.20 ± 0.01 | 0.09 ± 0.01 | 0.14 ± 0.01 | 0.10 ± 0.00 |
| Collision-car | 0.24 ± 0.01 | 0.12 ± 0.01 | 0.28 ± 0.06 | 0.12 ± 0.01 |
| Collision-pedestrian | 5.4 ± 2.0 | 2.0 ± 0.3 | 7.3 ± 1.9 | 2.8 ± 0.1 |
Table 4: Average number of kilometers travelled before an infraction by the reinforcement learning agent. We show mean and standard deviation over three runs.
To run the driving benchmark for imitation learning go to the imitation learning repository. To run the driving benchmark for reinforcement learning go to the reinforcement learning repository.
Randomness in CARLA
As we can see from the result tables, there is a non-zero amount of variation in the results when running the driving benchmark multiple times. We have put effort into making the experiments as reproducible as possible, yet, there are two known sources of non-determinism:
- Different load time for textures: In Unreal Engine, loading time of textures is not completely deterministic, which leads to minor appearance differences.
- Pedestrians algorithms are non-deterministic (See #258 ).
To give a clearer insight, in the following video we compare the frames of two different runs in the same machine and with the same random seeds. The CARLA autopilot was used to drive the car. The pixels in red show when there is a difference between the images from the two runs.
As we can see, until time 0:20 there are no many differences, except in few positions. These differences are explained by different loading texture time. After, at the time 0:20, there is a pedestrian crashing into another. This crash already changes the course of the simulation, since it caused an extra wait for the agent.
CARLA experiments are reproducible, but not entirely deterministic. This explains small variation between runs of the benchmark. Luckily, in our experiments we found that the variance between runs is generally not extremely large. We will be working on improving the determinism of CARLA in the future.
Can you beat our agents ?
Please post your results for the CoRL-2017 benchmark in the comments section below or send them with documentation or code to carla.driving.benchmark@gmail.com. As soon as we have enough material, we promise another blog post reviewing the best-performing agents in CARLA.
Feedback
We are committed to improving CARLA and making sure it becomes the standard tool for evaluation of autonomous driving algorithms. Therefore, we are very happy to hear your comments and suggestions regarding the driving benchmark. Please contact us on github!